Attack Path Analysis: How to Map Enemy Routes Before They Move
You can stop breaches by mapping the chain of steps attackers use, revealing hidden weak links that single-point defenses miss entirely.
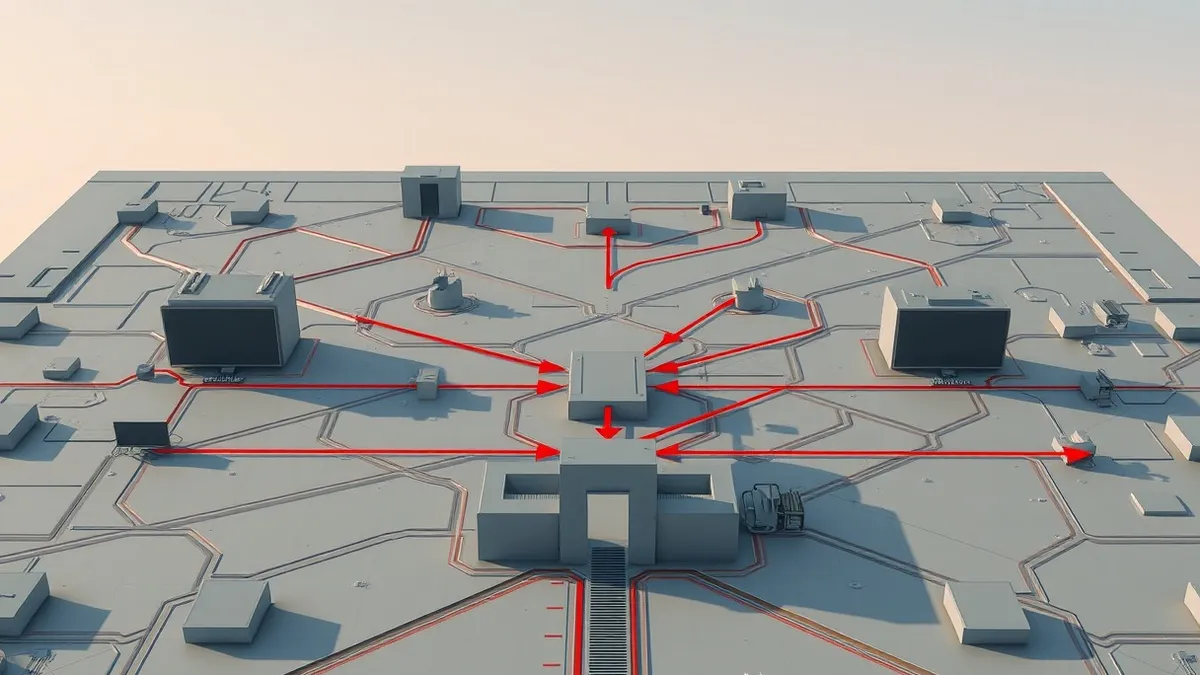
Attack path analysis maps every possible route from an entry point to your critical data. It treats security as a connected graph rather than isolated walls. This reveals single points of failure and shows you exactly which controls will block the most realistic threats.
The Maze vs The Wall
Imagine you are protecting a museum with a single, high wall. You spend all your resources making that wall thicker. An attacker simply finds a gap in the fence, climbs over, and walks straight to the crown jewels. Now imagine you treat the museum as a maze. You know that to steal the jewels, the thief must first bypass the turnstile, then pass the security desk, then open the glass case. If you block any one of those steps, the theft fails. Attack path analysis is the process of drawing that maze. It moves you from thinking about individual walls to thinking about the journey an adversary takes.
Most security tools look at a single door or a single lock. They tell you if a specific server has a missing patch. They do not tell you if that server allows an attacker to reach your customer database. This gap is why organizations with strong perimeters still suffer breaches. You need to see the connections between assets, not just the assets themselves.
The Mechanics of Connection
At its core, this analysis relies on graph theory. In this context, a graph is a mathematical structure consisting of nodes and edges. Your servers, users, and databases are the nodes. The connections between them—such as a user having admin rights on a server—are the edges. By mapping these, you create a visual model of your environment.
This model allows you to simulate movement. You can trace a path from an internet-facing web server to an internal database. The tool calculates the likelihood of an attacker traversing that path. It identifies the "shortest path" in terms of security controls, not physical distance. This is where the insight changes. A weak password on a low-priority server might seem harmless in isolation. But if that server grants access to your financial records, that weak password becomes the front door.
Why Isolated Scoring Fails
Vulnerability scanners give you a score for each finding. A critical score means the flaw is easy to exploit. But it says nothing about the value of the asset or its connectivity. This is a common trap. You patch the highest-scoring vulnerabilities first, assuming you are reducing risk. Often, you are not.
Suppose you have a critical vulnerability on a server that is air-gapped from your core systems. Patching it is good practice, but it does not stop an imminent breach. Conversely, a medium-severity vulnerability on a gateway server might be the only thing stopping an attacker from reaching your secrets. Attack path analysis re-prioritizes your work. It tells you which vulnerabilities actually lead to your crown jewels. This shifts your focus from "how many bugs do we have" to "how close are we to being breached."
The Hidden Cost of Access
One non-obvious consequence of this analysis is the exposure of privilege creep. Over time, employees and services accumulate permissions they no longer need. A developer might have kept admin rights from a project five years ago. A service account might have broad network access. These permissions are invisible to traditional audits. They sit in the background, waiting to be used.
When you map the attack paths, these stale permissions appear as direct highways. An attacker does not need to hack their way through complex defenses if a legitimate account already has the keys. This is often the easiest path for an adversary. It is also the hardest to detect with signature-based tools because the traffic looks normal. You are seeing legitimate credentials being misused.
Integrating with Threat Models
To make this analysis actionable, you must align it with known adversary behaviors. You can use frameworks like the MITRE ATT&CK Navigator to label your edges with specific techniques. This adds context to your map. It tells you not just that a path exists, but how an attacker would likely traverse it.
You can also feed data from threat intelligence platforms into your model. If a new exploit is targeting a specific software version, your map can instantly show you which paths are now exposed. This turns static data into dynamic risk assessment. You are no longer guessing where the threat is coming from. You are preparing for the specific routes attackers are currently using.
See also: DFIR Training for Small Business Threat Readiness · Threat Hunting Best Practices: 7 Methods to Find Hidden Threats
A Note on Data Sources
This analysis requires accurate inventory data. If your map is wrong, your conclusions are wrong. You cannot map a path to a server you do not know exists. This is where OSINT investigations can help you understand your external footprint. It reveals what the internet sees, which is often different from what your internal tools report.
Similarly, user and entity behavior analytics can provide the telemetry needed to validate your paths. If your map says Server A talks to Server B, but the analytics show no traffic, your map needs updating. Accuracy is the foundation. Without it, you are drawing a maze that does not exist.
Try This Now
- Inventory your critical assets. List the three systems that would cause the most damage if compromised. Do not list all servers. Start small.
- Identify the entry points. List the systems that face the internet or accept external input. These are your starting nodes.
- Map the connections. Draw lines from each entry point to your critical assets. Note every user, service account, or network rule that connects them. Look for the shortest chain.
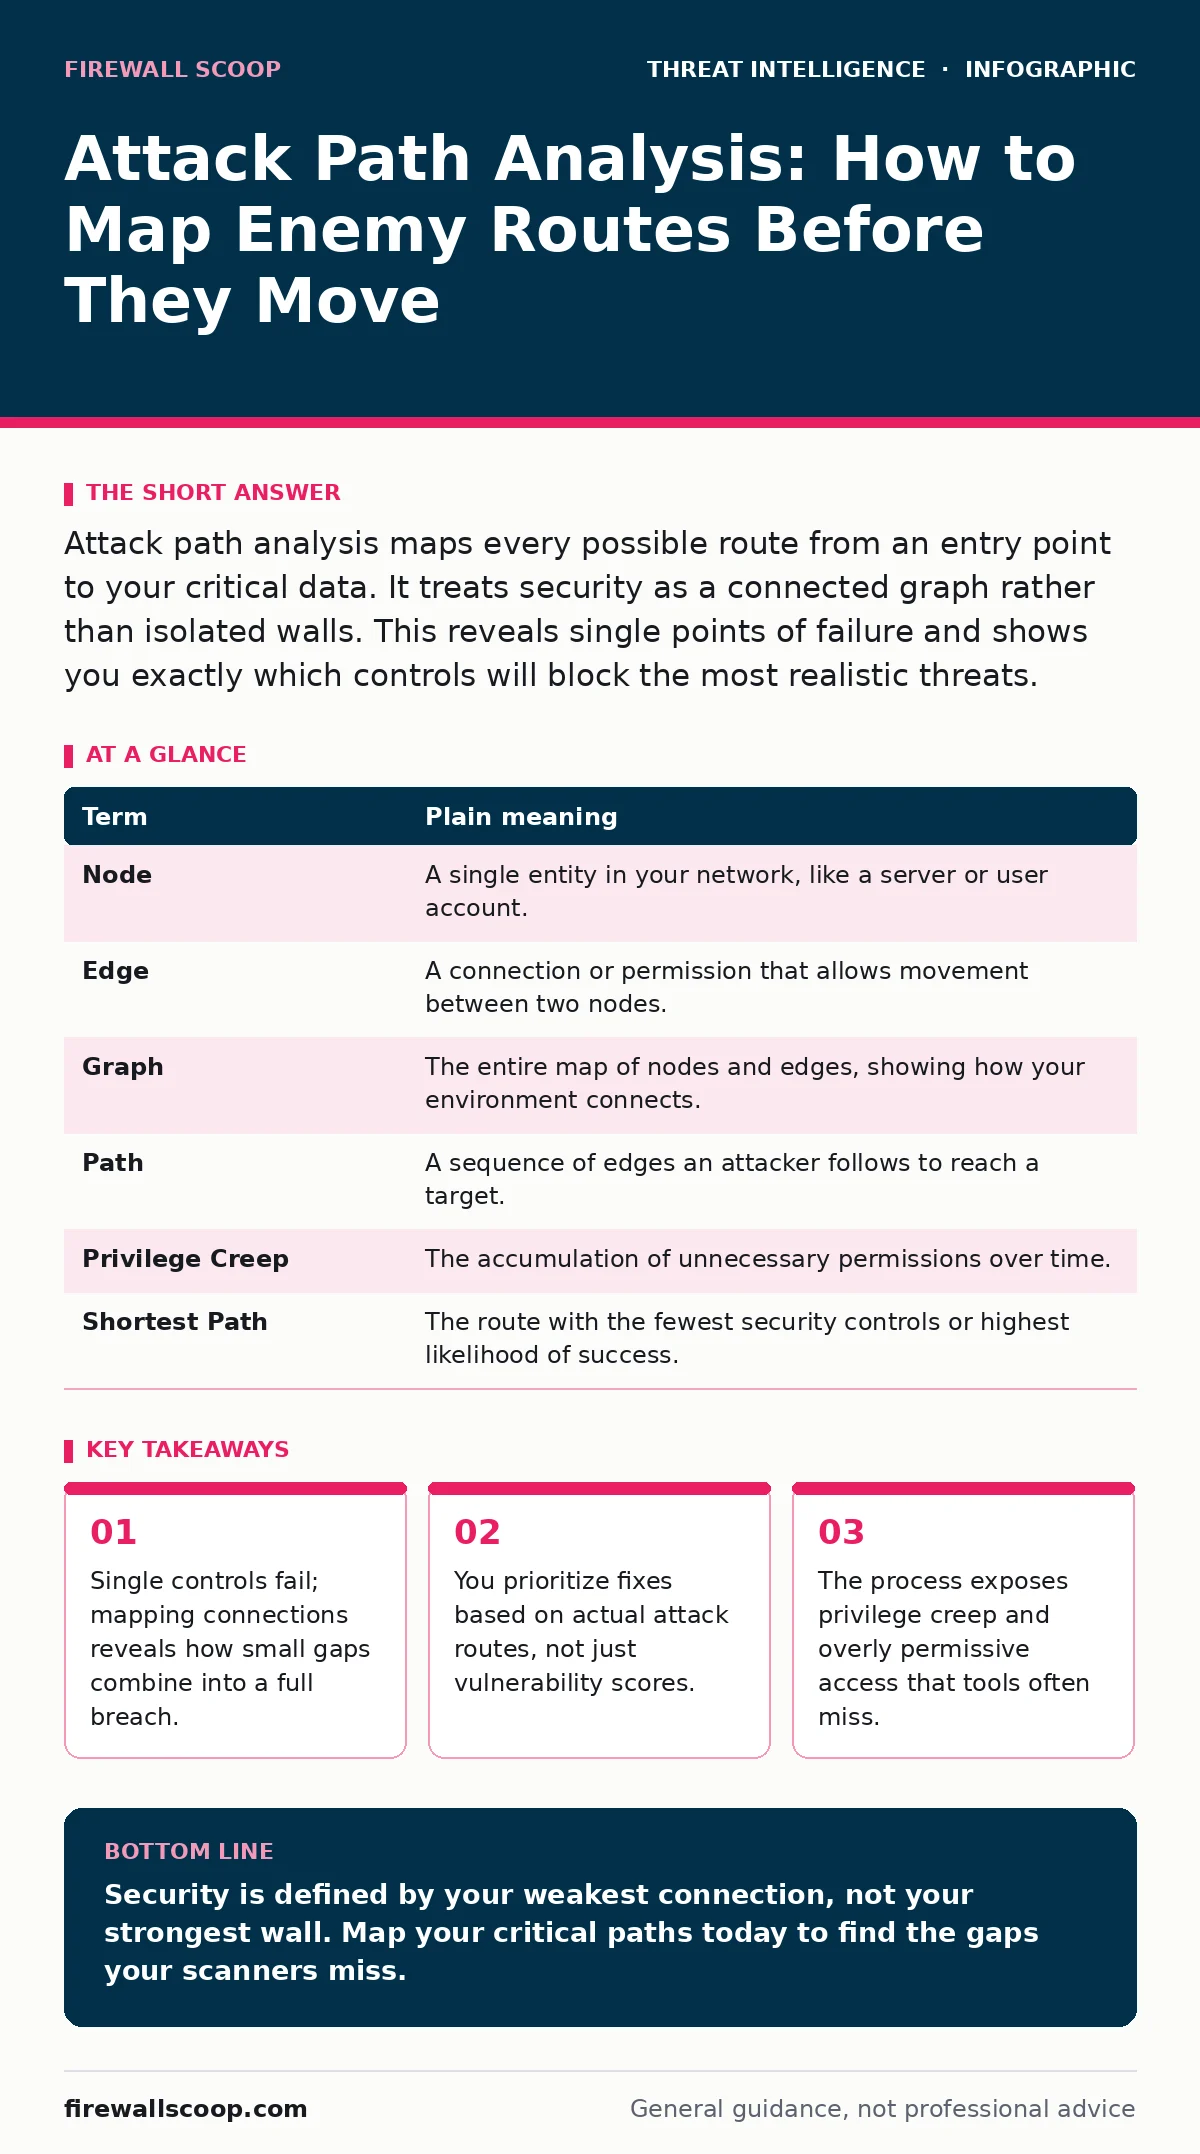
| Term | Plain meaning |
|---|---|
| Node | A single entity in your network, like a server or user account. |
| Edge | A connection or permission that allows movement between two nodes. |
| Graph | The entire map of nodes and edges, showing how your environment connects. |
| Path | A sequence of edges an attacker follows to reach a target. |
| Privilege Creep | The accumulation of unnecessary permissions over time. |
| Shortest Path | The route with the fewest security controls or highest likelihood of success. |
The Limit of the Map
This analysis does not stop attacks by itself. It shows you where to apply your defenses. It is a planning tool, not a shield. You still need to patch systems, enforce least privilege, and monitor for anomalies. But now you know exactly which patches matter most.
Imagine you are a burglar studying a house. You look for the unlocked window, the broken lock, the open door. Attack path analysis lets you see the house through those eyes. You find the gaps before they do. This shifts you from reactive firefighting to proactive defense. You control the narrative of your own security.
Key takeaways
- Single controls fail; mapping connections reveals how small gaps combine into a full breach.
- You prioritize fixes based on actual attack routes, not just vulnerability scores.
- The process exposes privilege creep and overly permissive access that tools often miss.
Security is defined by your weakest connection, not your strongest wall. Map your critical paths today to find the gaps your scanners miss.
Frequently asked questions
How often should I update my attack path map?
Update it whenever your infrastructure changes. Major changes like new servers or modified access rights require immediate re-mapping to ensure accuracy.
Do I need expensive software to do this?
No. You can start with a whiteboard and your inventory data. The value comes from the analysis, not the tool. Simple spreadsheets work for small environments.
Can this analysis detect active attackers?
No. It identifies potential routes. To detect active use of these routes, you need real-time monitoring and logging combined with your map.
How does this relate to honeypots?
Honeypots can act as decoy nodes in your map. If an attacker interacts with a honeypot, your map can show if that interaction is connected to real assets.
How this guide was produced: written by the Firewall Scoop editorial team with AI assistance, checked against the public references listed below, and reviewed when the facts change. See our editorial policy or report an error.